Ease of Use of EC™
Fast and easy application
Fast and easy application
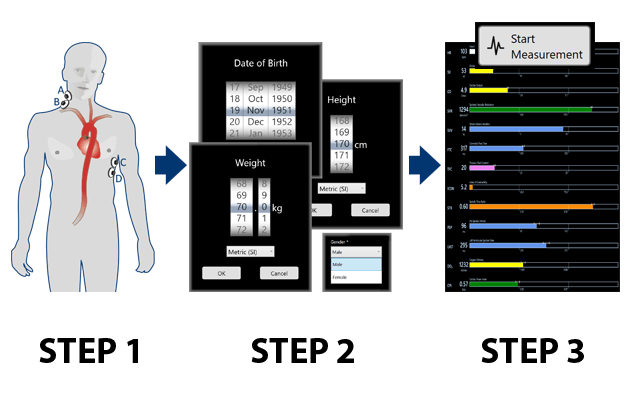
Application of Electrical Cardiometry™ (EC™) requires the attachment of four skin sensors to the patient, two above the onset of the neck and other two on the left side of the thorax. Enter the patient’s age, weight, height and gender and the EC™ devices are ready for measurement!
After a short validation of the impedance and ECG signal, Electrical Cardiometry™ devices display within a few seconds estimates for hemodynamic parameter values.
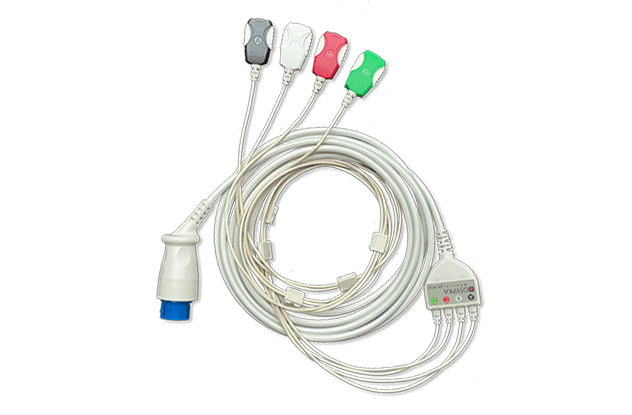
The patient cables for Electrical Cardiometry™ feature labeled and color-coded leads which must be attached to specific sensors (not applicable to prewired sensors). Sensors are offered for the patient groups: neonates, pediatrics and adults. Especially premature neonates with very fragile skins are demanding special care.
Different kind of user interfaces allow an easy interpretation of the hemodynamic parameter values and trends. Preferred screen settings can be defined.
ICON® offers several screens, of which the displayed parameter and/or signal waveforms are configurable.
Toggle between screens by pressing a button.

Graphical representation of six parameter values in a chart diagram, each with respect to their normal range. Numerically display of parameter values. Each of the parameter fields is user configurable.

Course of two parameter values over time. Two markers can be placed, A and B.

Display of two or four parameter values and one or two signal waveforms (surface ECG, impedance change ΔZ, or rate of impedance change dZ/dt).

Current parameter values shown numerically and graphed with respect to their normal values. Can be stored and exported as PDF.
The PC software application iControl™ provides a comprehensive user interface and a patient data management and is used with ICONCore®.

Graphical representation of parameter values in a chart diagram, each with respect to their normal range. Numerically display of parameter values. Each parameter field is user configurable.

Course of user-configurable parameters over time. During measurement, a user may set predefined or free text markers.

Hemodynamic status assessment considering stroke volume and blood pressure.

Passive Leg Raise (PLR) Test protocol for assessing volume responsiveness according to Frank-Starling.

Status reports can be flagged during measurement. Create PDFs of single or comparative status reports any time during measurement or retrospectively.
Comparative status reports allow direct comparison of two hemodynamic states, for instance, pre and post therapy on one sheet.

Measurement data sets are automatically saved beat by beat. Before exporting this data to a text file (*.csv; ready for import into spreadsheet applications), the data can be restricted, filtered and / or averaged.

Structured diagnostics and therapy supported by the visualization of the interactions of the hemodynamic variables preload, contractility and afterload and their influence on stroke volume and, taking heart rate into account, on cardiac output.
You need to load content from reCAPTCHA to submit the form. Please note that doing so will share data with third-party providers.
More InformationYou are currently viewing a placeholder content from Turnstile. To access the actual content, click the button below. Please note that doing so will share data with third-party providers.
More InformationYou are currently viewing a placeholder content from Facebook. To access the actual content, click the button below. Please note that doing so will share data with third-party providers.
More InformationYou are currently viewing a placeholder content from Instagram. To access the actual content, click the button below. Please note that doing so will share data with third-party providers.
More InformationYou are currently viewing a placeholder content from X. To access the actual content, click the button below. Please note that doing so will share data with third-party providers.
More Information